
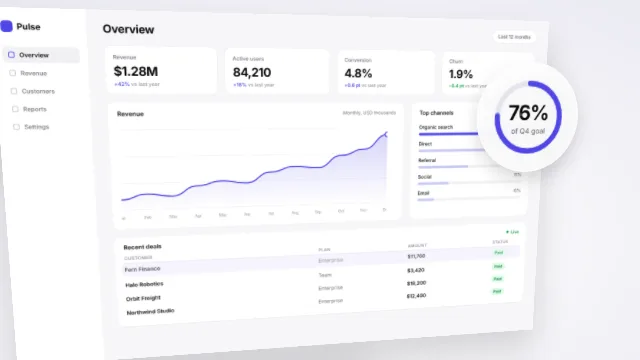
Revenue chart animation
Revenue year over year, +42%, 87%: charts and counters drawn by a live code layer.
- Format
- 16:9 · 11 s
- Scenes
- 2
- Editable text
- 6 layers
- Fonts
- Inter
Free account. Opens a copy in the Kineform studio, ready to edit.
Made for “Pulse”, a fictional brand. Swap in your own.
What's inside
- Live code layer
- 16 layers in total, every one editable
Scenes
- Dashboard
- End card
Words you'll replace
“Revenue, year over year” · “+42%” · “87%” · “of Q4 goal” · “Pulse” · “Know your numbers. Live.”
How to make it yours
- Press “Use this template”. A copy opens in the Kineform studio — nothing to install.
- Rewrite any text, replace the photos and screens with your own, and set your brand colours and fonts.
- Or ask the built-in agent: “use our logo and colours, and change the headline to …”.
- Export MP4, WebM, GIF or a PNG sequence. Rendering happens on your own machine.
Similar templates
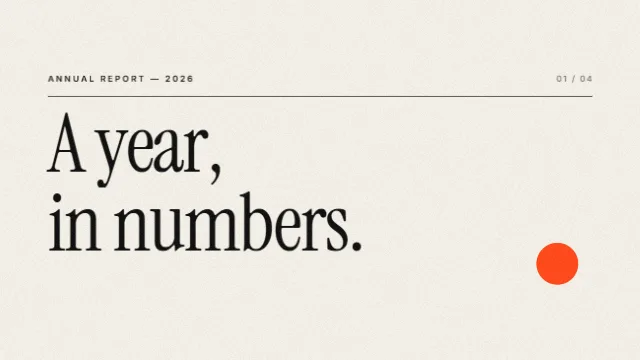
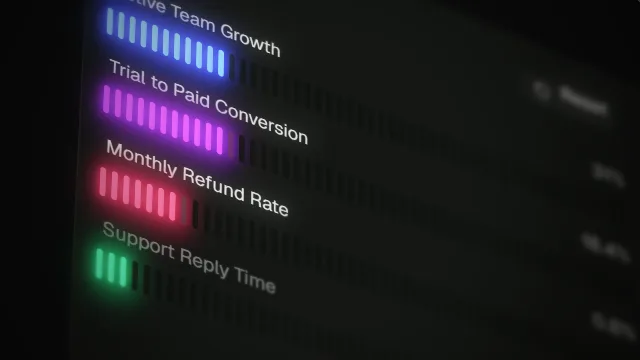
Every frame stays editable
Kineform templates are real projects on a real-time engine — 3D, light, glass, type and video — not flattened clips. Open one, change anything, export.